Y.Graph3D为基于ILNumerics类库(1.4版本)以及ILNumerics.Drawing(0.9版本)实现的自定义控件,开源授权符合LGPL定义
类库中引用了量测常用的Intensity Graph以及Surface Graph等两种图表控件
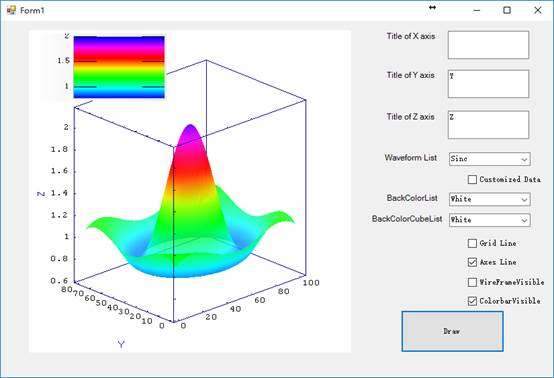
Surface Graph 类
Surface Graph 包含的属性以及方法如下表所示
|
属性 |
|
|
属性名称 |
功能描述 |
|
AxesLineVisible |
设定是否在SurfaceGraph中显示轴线标注,默认为True。 |
|
BackgroundColor |
设定SurfaceGraph中绘图区外的背景颜色,默认为White |
|
CubeColor |
设定SurfaceGraph中绘图区颜色,默认为White |
|
CubeGridVisible |
设定是否在SurfaceGraph中显示方网格线,默认为false。 |
|
WireframeVisible |
设定是否在SurfaceGraph上显示网格,默认为false。 |
|
XAxisTitle |
设定SurfaceGraph中X轴的标注文字,默认为X。 |
|
YAxisTItle |
设定SurfaceGraph中Y轴的标注文字,默认为Y。 |
|
ZAxisTitle |
设定SurfaceGraph中Z轴的标注文字,默认为Z。 |
|
BackColorOfColorBar |
设定SurfaceGraph中Colorbar的背景颜色,默认为White |
|
BorderStyleOfColorBar |
设定SurfaceGraph中Colorbar的线条类型,默认为FixedSingle |
|
HeightofColorBar |
设定SurfaceGraph中Colorbar的高度,默认为120 |
|
Position |
设定SurfaceGraph中Colorbar距离左上方的位置点,默认为(5,5) |
|
VisibleColorBar |
设定是否在SurfaceGraph中显示ColorBar,默认为True。 |
|
WidthofColorBar |
设定SurfaceGraph中Colorbar的宽度,默认为120 |
|
方法 |
|
|
方法名称 |
功能描述 |
|
Plot (double[,]) |
绘制图表(给予2Ddouble数组) |
|
Plot (stdWfm) |
绘制图表(使用内嵌的标准数组,Sync以及Waterfall) |
|
Refresh() |
重新绘制图表 |
|
ColorBarUpdate() |
更新ColorBar |
图形绘制完成后,鼠标左键单击可放大检视,右键单击可缩小检视,双击恢复默认大小,鼠标拖曳可改变视角
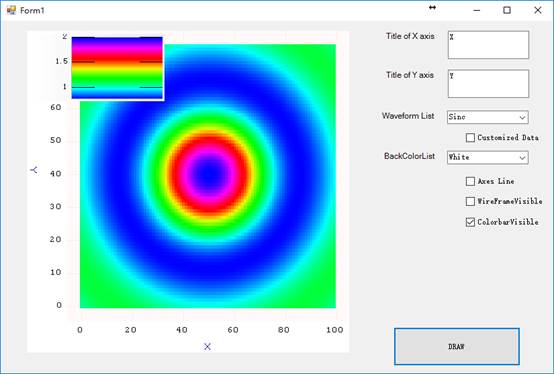
Intensity Graph 类
Intensity Graph 包含的属性以及方法如下表所示
|
属性 |
|
|
属性名称 |
功能描述 |
|
AxesLineVisible |
设定是否在IntensityGraph中显示轴线标注,默认为True。 |
|
BackgroundColor |
设定IntensityGraph中绘图区外的背景颜色,默认为White |
|
WireframeVisible |
设定是否在IntensityGraph上显示网格,默认为false。 |
|
XAxisTitle |
设定IntensityGraph中X轴的标注文字,默认为X。 |
|
YAxisTItle |
设定IntensityGraph中Y轴的标注文字,默认为Y。 |
|
BackColorOfColorBar |
设定IntensityGraph中Colorbar的背景颜色,默认为White |
|
BorderStyleOfColorBar |
设定IntensityGraph中Colorbar的线条类型,默认为FixedSingle |
|
HeightofColorBar |
设定IntensityGraph中Colorbar的高度,默认为120 |
|
Position |
设定IntensityGraph中Colorbar距离左上方的位置点,默认为(5,5) |
|
VisibleColorBar |
设定是否在IntensityGraph中显示ColorBar,默认为True。 |
|
WidthofColorBar |
设定IntensityGraph中Colorbar的宽度,默认为120 |
|
方法 |
|
|
方法名称 |
功能描述 |
|
Plot(double[,]) |
绘制图表(给予2Ddouble数组) |
|
Plot(stdWfm) |
绘制图表(使用内嵌的标准数组,Sync以及Waterfall) |
|
Refresh() |
重新绘制图表 |
|
ColorBarUpdate() |
更新ColorBar |
图形绘制完成后,鼠标左键单击可放大检视,右键单击可缩小检视,双击恢复默认大小,鼠标拖曳可改变视角